Using a survey results presentation template offers several benefits, including:

- Saves time and effort in creating a presentation from scratch.
- Ensures a professional and consistent presentation style.
- Helps focus on the key findings of the survey.
- Makes it easier for the audience to understand and interpret the results.
When choosing a survey results presentation template, it is important to consider the following factors:
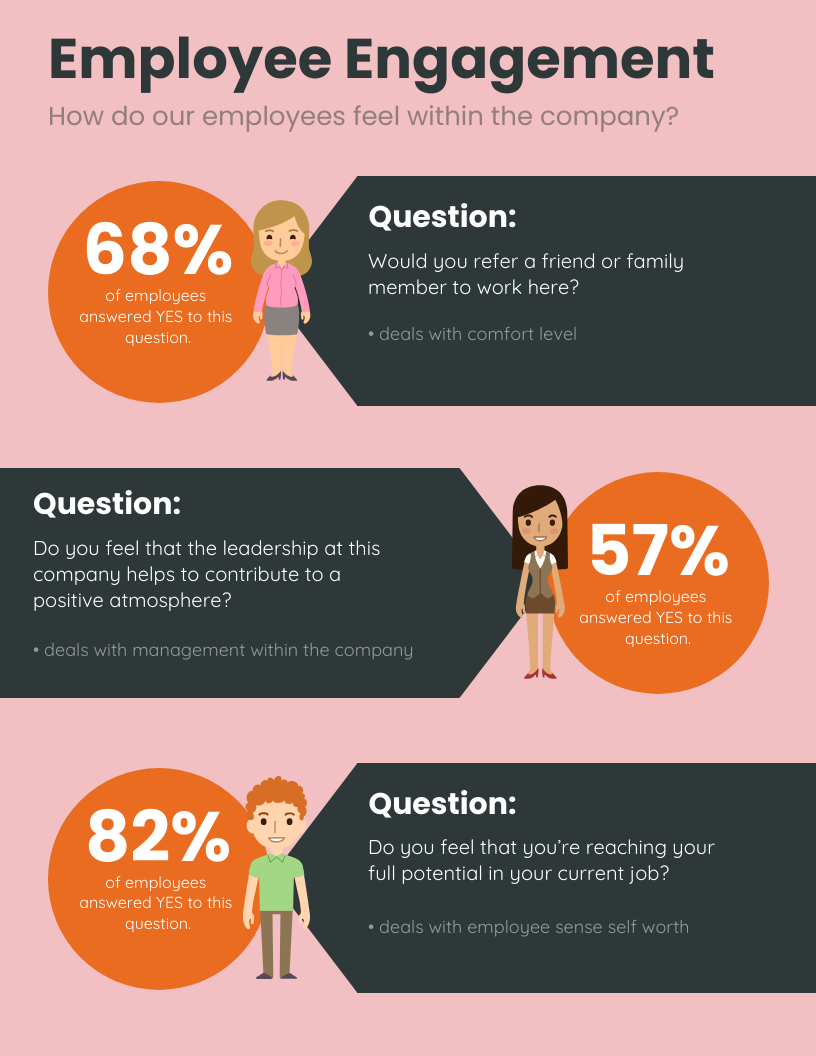
- The type of survey conducted (e.g., customer satisfaction, market research, employee engagement).
- The size and complexity of the dataset.
- The desired presentation style (e.g., formal, informal, interactive).
Once a template has been selected, it can be customized to fit the specific needs of the presentation. This may involve adding or removing sections, changing the design elements, or incorporating additional data or visuals.
By using a survey results presentation template, presenters can effectively communicate the findings of their survey in a way that is both engaging and informative.
Key Components of a Survey Results Presentation Template
An effective survey results presentation template should include the following key components:
1: Title slide
The title slide should include the title of the presentation, the name of the presenter, the date, and any other relevant information.
2: Executive summary
The executive summary should provide a brief overview of the key findings of the survey. This section should be concise and easy to understand, and it should highlight the most important insights from the data.
3: Methodology
The methodology section should describe how the survey was conducted. This includes information about the sample size, the sampling method, and the data collection methods. Providing this information helps the audience to understand the strengths and limitations of the survey.
4: Results
The results section should present the findings of the survey in a clear and organized way. This may involve using tables, graphs, and charts to illustrate the data. The results section should be divided into logical subsections, and each subsection should focus on a specific aspect of the survey findings.
5: Discussion
The discussion section should interpret the findings of the survey and discuss their implications. This section should provide insights into the meaning of the data and explore the potential implications for the organization or audience. The discussion section should also identify any limitations of the survey and suggest areas for further research.
6: Recommendations
The recommendations section should provide specific recommendations based on the findings of the survey. These recommendations should be actionable and relevant to the audience. The recommendations section should also be prioritized, with the most important recommendations listed first.
7: Conclusion
The conclusion should summarize the key findings of the survey and restate the main recommendations. The conclusion should also provide a call to action, encouraging the audience to take the next steps.
By including these key components, survey results presentation templates can help presenters to effectively communicate the findings of their survey in a way that is both engaging and informative.
How to Create a Survey Results Presentation Template
A survey results presentation template is a pre-designed framework that helps organize and present the findings of a survey in a visually appealing and easy-to-understand format. Using a template can save time and effort, ensure a professional and consistent presentation style, and help focus on the key findings of the survey.
To create a survey results presentation template, follow these steps:
1: Define the purpose and audience of the presentation.
2: Gather the survey data and analyze the results.
3: Choose a presentation template that fits the purpose and audience.
4: Customize the template to fit the specific needs of the presentation.
5: Add visuals, such as charts and graphs, to illustrate the data.
6: Write a clear and concise narrative that explains the findings of the survey.
7: Proofread the presentation carefully before presenting it.
By following these steps, you can create a survey results presentation template that is both informative and engaging.
A survey results presentation template is a valuable tool for effectively communicating the findings of a survey. By using a template, presenters can save time and effort, ensure a professional and consistent presentation style, and focus on the key findings of the survey. When choosing a template, it is important to consider the type of survey conducted, the size and complexity of the dataset, and the desired presentation style. Once a template has been selected, it can be customized to fit the specific needs of the presentation. By following these steps, presenters can create a survey results presentation template that is both informative and engaging.
Survey results presentation templates are becoming increasingly important in today’s data-driven world. As organizations collect more and more data, they need effective ways to communicate the findings of their surveys to stakeholders. A well-designed survey results presentation template can help organizations to make better use of their data and make more informed decisions.

